Tracking Users in Wireless Computer Networks
For my graduation thesis I had an assignment to check how can one track users in wireless networks. Until few years ago, we did not have a device with Wi-Fi capabilities which we carried continuously with us. Well, there were laptops and PDAs, but laptops are generally turned off when we carry them, and PDAs were not so widespread. With the advent of (cheaper) smartphones and tablets, more and more people constantly carry devices that have Wi-Fi turned on.
The thing is, before any wireless device can connect to the wireless network, they must first find one. The process of finding Wi-Fi networks is called scanning. After the Wi-Fi device finds the desired Wi-Fi network, the process of authentication and association to the network can begin. The network scanning is specifically interesting when it comes to tracking of users.
Wi-Fi devices can try to find networks either passively or actively. In passive mode, Wi-Fi device listens to Beacon frames which are sent by Access Points (APs) on each Wi-Fi channel. Beacon frames contain technical information of the available wireless network. AP typically sends Beacon frames every one hundred milliseconds or so. In the world of Wi-Fi networks this is considered slow. Because of that it is also possible to search for networks actively by using Probe request frames. In active search mode, the Wi-Fi device sends Probe requests on each channel and waits for a response from the AP. Probe response which AP will then send also contains information about the available networks on the AP.
How often Wi-Fi devices send probe requests depends on the device manufacturer. Different devices will send probe requests at different intervals. Devices will send requests depending on whether the device is actively used, whether it is already assigned to some network or not, depending on the quality of the signal on current network, operating system of the device, device driver, the amount of energy available in the battery, if the device moves (accelerometer), etc. For the purpose of my graduation thesis I made a little test with three devices. I tested them when their screen was on and off (active device or device is in sleep mode), and in the case when they were associated to the network and when not. When sending probe requests, devices can specify the SSID of the network they want information from. Such request is called a Directed Probe Request. From such requests we can extract the SSIDs of the networks which devices previously connected to. Notice that devices will send probe requests no matter if they are currently associated to some network or not (they always want to know about available networks).
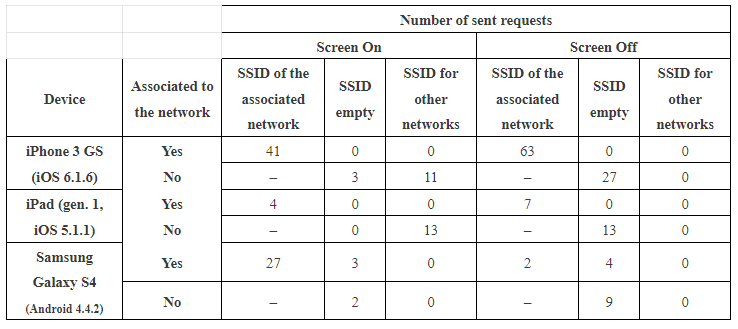
In this test, the iPhone 3GS sent most frames (63) when its screen was off (not actively used) and when it was associated to some network. The least number of probe requests was sent by Galaxy S4 when the screen was on and when it wasn’t associated to the network. This of course is not a representative sample of all models of smartphones, but it gives us some idea of how devices send probe requests. What we can conclude is that within 10 minutes, we can expect that Wi-Fi devices will send probe request. Here is a picture from Wireshark in which we can see how Probe Request looks like.
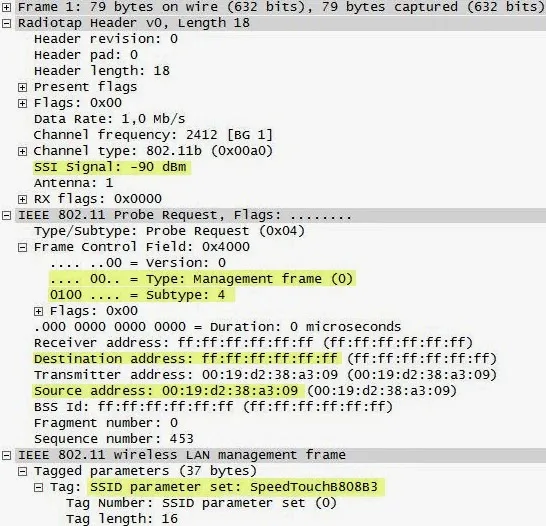
In this example I have marked interesting information with yellow color. We can see that this is a Management frame (this is the type of frame), and a subtype is the Probe Request (No. 4). We can also see the source MAC address, which is the identifier of the device which sent the request. The destination address is the broadcast address. The SSID is also specified, which means that the device is seeking information for that SSID only. Only AP with that SSID will respond to this request. When the Probe Request does not contain the SSID, all APs in the range will answer and provide information about the networks they provide in the Probe Response frame.
So, let’s look at the facts:
- We carry Wi-Fi enabled device with us (typically smartphone)
- Every device has a unique MAC address
- Devices send Probe Requests relatively often
- Probe Requests are not encrypted
- Anyone with a wireless card can capture the Wi-Fi traffic
This means that…
To check this hypothesis, I have made an experiment in which I have collected Probe Requests on two different locations in Zagreb, Croatia, and one location in Dugo Selo, Croatia. I have configured three stations which were used to capture probe requests. I used computers with Kali Linux distribution and TP-Link TL-WN722N and D-Link AirPlus G DWL-G122 wireless cards. Cards were put to monitor mode (mode in which it will only listen for signals on specific channel) using airmon-ng script. I used Wireshark to capture frames and save them for each location separately. When the capture was complete I exported all frames to XML files, which were then parsed using PHP script on an Apache web server. Information from frames in the XML files was saved to MySQL database.
Once I had all frames saved in database, I could easily create different reports from the data I collected. In summary, I collected 4 981 268 frames from 37 440 different devices (different MAC addresses). From MAC addresses I found information about 122 device manufacturers by using macvendorlookup.com API. From Directed Probe Requests I collected 23 793 different SSIDs.
Here are a few diagrams showing some statistics fromcollected data:
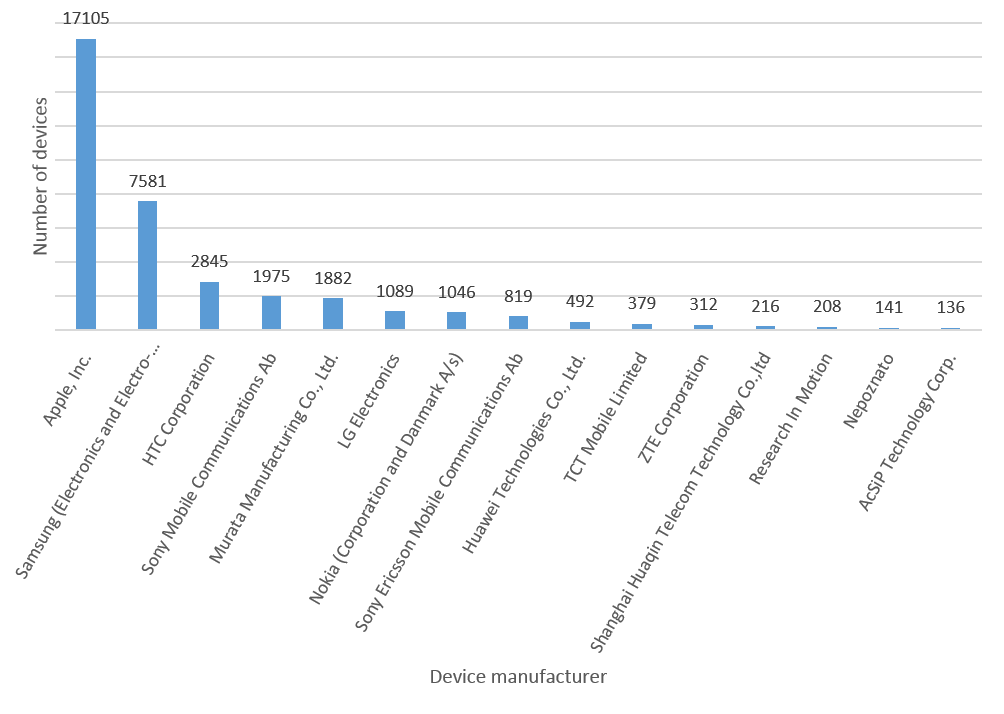
From the diagram we can see that Apple is the most popular brand (45,5 %). Samsung is second (20,2 %), and HTC is third (7,6 %).
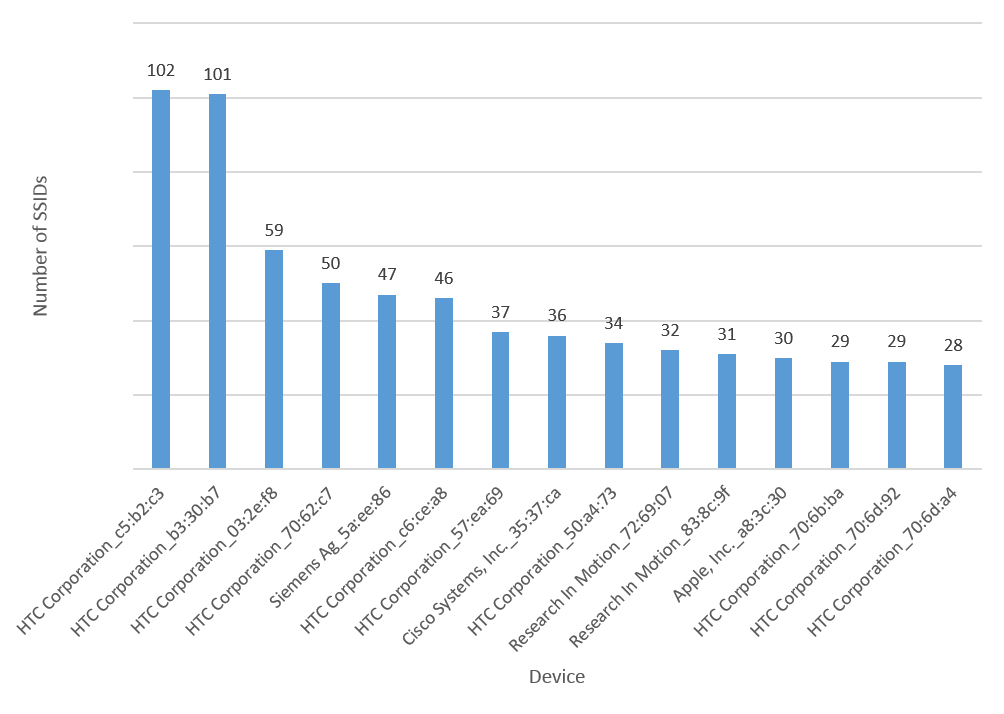
This diagram is very interesting. The HTC device with 102 different connected networks probably belongs to a person which travels a lot (lots of SSIDs were the names of hotels).
The most popular wireless network was “Grad Zagreb” with 1 440 connected devices.
This is only statistics, but we can also generate different reports based on the collected data. For example, I can show which device was on which location on specific date. I can also see how long the device was on the specific location. I can also generate reports on device movement between locations in which I capture data.
Another question that often arises when talking about Wi-Fi networks is the positioning of Wi-Fi devices, especially in closed spaces where GPS doesn’t work. The thing is, we can record the strength of the received signal on the capturing station. This is called the Received Signal Strength Indicator (RSSI). As it is known, the loss of strength of radio signals in free space happens due to the natural wave propagation in space, when the radio wave energy is distributed throughout a larger area. When the distance from the source of the wave is doubled, the signal strength drops 4 times (it is four times weaker). Another problem for signal strength indicator is Multipath. For example, waves can be reflected, refracted, diffracted, and scatter. Because of these phenomena, one signal can reach the receiver over multiple paths, which will cause different signal characteristics at the receiving side. This phenomenon is called Multipath.
Each device manufacturer interprets and defines the RSSI values in its own way, since RSSI is not standardized. So, Wireshark only displays the RSSI value provided by the driver of the wireless card. To check how RSSI is recorded on different distances we have made a little test.
Tested card was D-Link model AirPlus G DWL-G122. D-Link was showing around -40 dBm at 1 m and close to 80 dBm at 30 m.
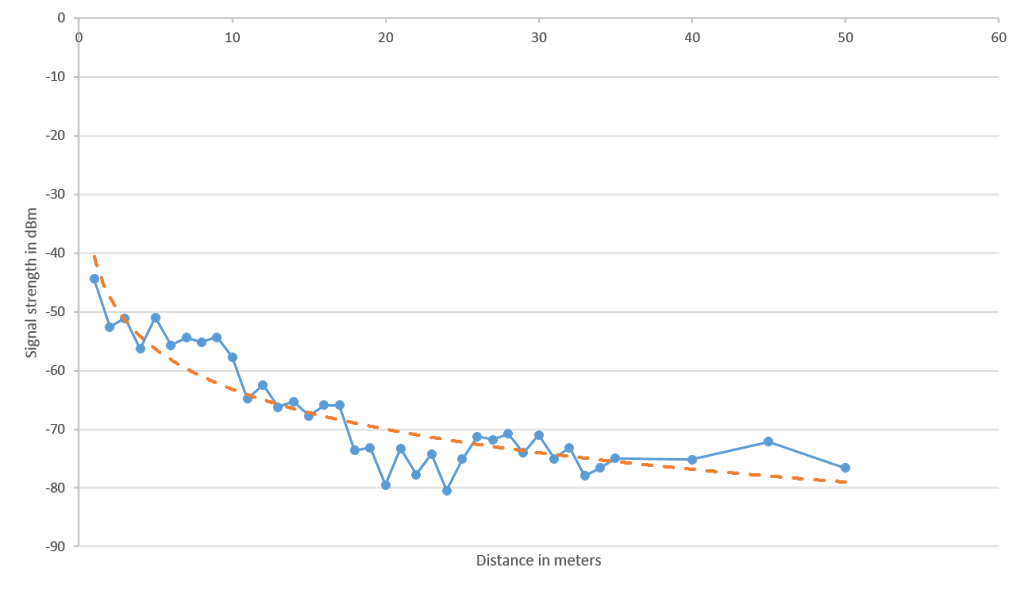
The diagram shows that the RSSI decreases with distance, so we can actually draw conclusions about the distance from the RSSI. Measurements were done at every meter from the antenna, and a sample of 30 Probe Requests were used on every meter. The blue dots show the average signal strength at a specific distance.
The problem is that the data is not precise. For example, in some cases, the signal was weaker at a greater distance than at the smaller distance. But, the orange dotted line is the trend line (average) of signal strength over distance. When looking at the trend line, we can get the average distance from the antenna, and we can include the error rate in our calculations (for example, standard deviation). In general, we should keep in mind that all this can be quite inaccurate.
In several scientific papers that have been used as a reference for my graduation thesis, the process of trilateration can be used to determine the position of Wi-Fi devices. Trilateration is geometric thing in which we can use circles, spheres or triangles to determine the distance of the device. Let’s look at the picture.
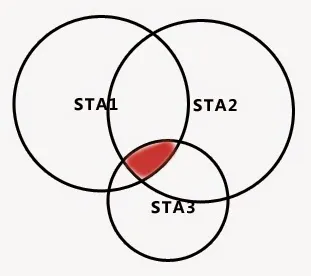
So, it is necessary to know the positions of capturing stations, which will be in the center of the circles. Other thing we will have to know are the radii of circles. The capturing stations need to be in range, so that all stations can receive the same signal from the device. Radius is necessary to identify a particular signal strength. The stronger signal means smaller radius, and the weaker signal means the larger radius of the specific circle. The place where the circles intersect represents the approximate position of the device.
If our closed space contains a lot of barriers (walls or alike), we will have a problem with trilateration. In that case, it will be difficult to determine which signal strength means which distance because barriers can reduce the signal strength while the distance remains the same.
The solution to the problem with barriers is to use more capturing stations, for example, in every room of the building. In that way, by looking at the capturing station in specific room which has the strongest signal for specific device, we can precisely determine the room in which the device is. To test this we have made a simple experiment with three capturing stations located in three different rooms. We then put an iPhone in one of those rooms and checked the signal strength on the capturing station for the MAC address of the iPhone. Results are shown on the picture:
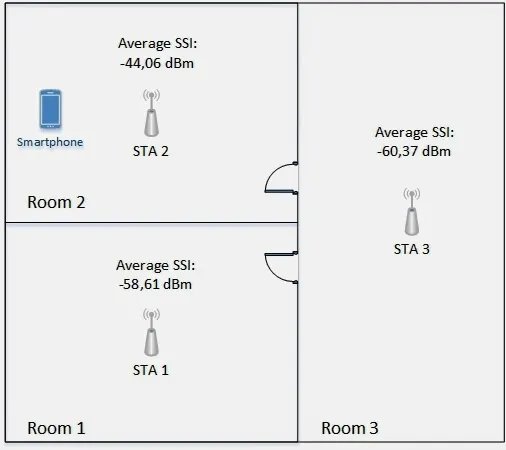
As you can see, the strongest signal was in Room 2, in which the iPhone was actually located. The signal on other capturing stations was much weaker, so it was easy to determine the room in which the iPhone is located.
I have published my graduation thesis here (it is written in Croatian).